Boston Unemployment Rate

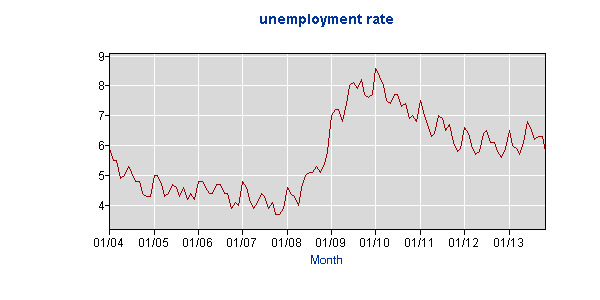
Unemployment Rate
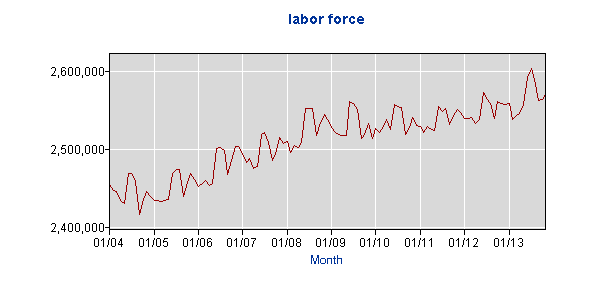
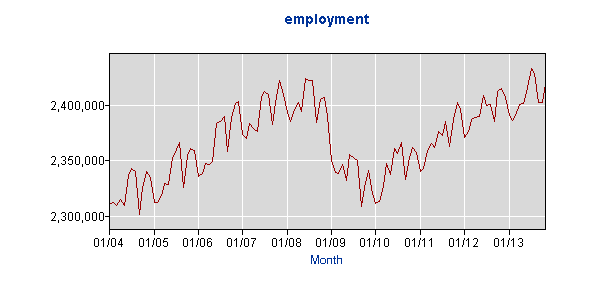
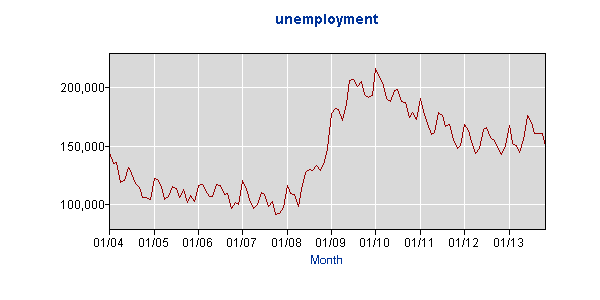
January, 2004 - October 2013, Statistics
| Year | Period | Labor Force | Employed | Unemployed | Rate % |
| 2004 | Jan | 2455282 | 2310950 | 144332 | 5.9% |
| 2004 | Feb | 2446961 | 2312049 | 134912 | 5.5% |
| 2004 | Mar | 2445607 | 2309976 | 135631 | 5.5% |
| 2004 | Apr | 2433837 | 2314851 | 118986 | 4.9% |
| 2004 | May | 2430006 | 2309189 | 120817 | 5.0% |
| 2004 | Jun | 2468866 | 2336915 | 131951 | 5.3% |
| 2004 | Jul | 2469649 | 2342651 | 126998 | 5.1% |
| 2004 | Aug | 2458767 | 2340477 | 118290 | 4.8% |
| 2004 | Sep | 2416134 | 2301245 | 114889 | 4.8% |
| 2004 | Oct | 2432105 | 2325663 | 106442 | 4.4% |
| 2004 | Nov | 2446526 | 2340279 | 106247 | 4.3% |
| 2004 | Dec | 2439926 | 2334950 | 104976 | 4.3% |
| 2005 | Jan | 2434159 | 2312001 | 122158 | 5.0% |
| 2005 | Feb | 2434073 | 2312124 | 121949 | 5.0% |
| 2005 | Mar | 2433738 | 2318636 | 115102 | 4.7% |
| 2005 | Apr | 2433805 | 2329125 | 104680 | 4.3% |
| 2005 | May | 2435340 | 2328513 | 106827 | 4.4% |
| 2005 | Jun | 2469259 | 2353456 | 115803 | 4.7% |
| 2005 | Jul | 2474449 | 2360578 | 113871 | 4.6% |
| 2005 | Aug | 2473597 | 2366982 | 106615 | 4.3% |
| 2005 | Sep | 2439533 | 2326323 | 113210 | 4.6% |
| 2005 | Oct | 2457619 | 2355207 | 102412 | 4.2% |
| 2005 | Nov | 2469116 | 2361422 | 107694 | 4.4% |
| 2005 | Dec | 2461644 | 2359011 | 102633 | 4.2% |
| 2006 | Jan | 2452790 | 2335896 | 116894 | 4.8% |
| 2006 | Feb | 2455972 | 2338245 | 117727 | 4.8% |
| 2006 | Mar | 2459805 | 2347864 | 111941 | 4.6% |
| 2006 | Apr | 2453564 | 2346591 | 106973 | 4.4% |
| 2006 | May | 2456723 | 2349365 | 107358 | 4.4% |
| 2006 | Jun | 2501171 | 2384119 | 117052 | 4.7% |
| 2006 | Jul | 2501963 | 2385279 | 116684 | 4.7% |
| 2006 | Aug | 2498857 | 2389719 | 109138 | 4.4% |
| 2006 | Sep | 2467581 | 2358031 | 109550 | 4.4% |
| 2006 | Oct | 2486219 | 2389186 | 97033 | 3.9% |
| 2006 | Nov | 2504076 | 2402138 | 101938 | 4.1% |
| 2006 | Dec | 2503776 | 2403784 | 99992 | 4.0% |
| 2007 | Jan | 2494165 | 2373591 | 120574 | 4.8% |
| 2007 | Feb | 2483587 | 2370300 | 113287 | 4.6% |
| 2007 | Mar | 2488411 | 2384130 | 104281 | 4.2% |
| 2007 | Apr | 2476025 | 2379428 | 96597 | 3.9% |
| 2007 | May | 2477648 | 2376869 | 100779 | 4.1% |
| 2007 | Jun | 2519405 | 2408593 | 110812 | 4.4% |
| 2007 | Jul | 2522065 | 2412803 | 109262 | 4.3% |
| 2007 | Aug | 2508854 | 2410306 | 98548 | 3.9% |
| 2007 | Sep | 2485497 | 2382513 | 102984 | 4.1% |
| 2007 | Oct | 2494172 | 2402485 | 91687 | 3.7% |
| 2007 | Nov | 2515762 | 2422786 | 92976 | 3.7% |
| 2007 | Dec | 2508056 | 2410288 | 97768 | 3.9% |
| 2008 | Jan | 2509721 | 2393456 | 116265 | 4.6% |
| 2008 | Feb | 2496004 | 2386034 | 109970 | 4.4% |
| 2008 | Mar | 2505013 | 2396134 | 108879 | 4.3% |
| 2008 | Apr | 2501880 | 2403034 | 98846 | 4.0% |
| 2008 | May | 2508693 | 2394305 | 114388 | 4.6% |
| 2008 | Jun | 2552447 | 2424573 | 127874 | 5.0% |
| 2008 | Jul | 2552610 | 2422703 | 129907 | 5.1% |
| 2008 | Aug | 2552083 | 2423005 | 129078 | 5.1% |
| 2008 | Sep | 2518108 | 2384299 | 133809 | 5.3% |
| 2008 | Oct | 2534854 | 2405941 | 128913 | 5.1% |
| 2008 | Nov | 2544334 | 2407483 | 136851 | 5.4% |
| 2008 | Dec | 2537722 | 2390199 | 147523 | 5.8% |
| 2009 | Jan | 2527535 | 2350185 | 177350 | 7.0% |
| 2009 | Feb | 2521091 | 2339553 | 181538 | 7.2% |
| 2009 | Mar | 2519245 | 2338402 | 180843 | 7.2% |
| 2009 | Apr | 2518263 | 2346448 | 171815 | 6.8% |
| 2009 | May | 2517558 | 2331799 | 185759 | 7.4% |
| 2009 | Jun | 2561290 | 2356037 | 205253 | 8.0% |
| 2009 | Jul | 2559360 | 2352941 | 206419 | 8.1% |
| 2009 | Aug | 2551343 | 2350417 | 200926 | 7.9% |
| 2009 | Sep | 2513867 | 2308826 | 205041 | 8.2% |
| 2009 | Oct | 2519613 | 2325504 | 194109 | 7.7% |
| 2009 | Nov | 2532663 | 2341363 | 191300 | 7.6% |
| 2009 | Dec | 2513961 | 2320725 | 193236 | 7.7% |
| 2010 | Jan | 2527375 | 2311105 | 216270 | 8.6% |
| 2010 | Feb | 2521253 | 2313044 | 208209 | 8.3% |
| 2010 | Mar | 2528802 | 2327543 | 201259 | 8.0% |
| 2010 | Apr | 2537738 | 2347375 | 190363 | 7.5% |
| 2010 | May | 2525976 | 2337999 | 187977 | 7.4% |
| 2010 | Jun | 2558153 | 2360979 | 197174 | 7.7% |
| 2010 | Jul | 2554644 | 2356693 | 197951 | 7.7% |
| 2010 | Aug | 2554075 | 2366383 | 187692 | 7.3% |
| 2010 | Sep | 2519433 | 2332731 | 186702 | 7.4% |
| 2010 | Oct | 2527620 | 2353487 | 174133 | 6.9% |
| 2010 | Nov | 2541028 | 2362362 | 178666 | 7.0% |
| 2010 | Dec | 2530608 | 2357984 | 172624 | 6.8% |
| 2011 | Jan | 2529951 | 2339970 | 189981 | 7.5% |
| 2011 | Feb | 2522231 | 2342757 | 179474 | 7.1% |
| 2011 | Mar | 2529259 | 2359703 | 169556 | 6.7% |
| 2011 | Apr | 2525445 | 2365508 | 159937 | 6.3% |
| 2011 | May | 2523887 | 2361955 | 161932 | 6.4% |
| 2011 | Jun | 2554803 | 2376442 | 178361 | 7.0% |
| 2011 | Jul | 2548831 | 2373002 | 175829 | 6.9% |
| 2011 | Aug | 2552178 | 2385218 | 166960 | 6.5% |
| 2011 | Sep | 2531507 | 2363127 | 168380 | 6.7% |
| 2011 | Oct | 2543175 | 2387362 | 155813 | 6.1% |
| 2011 | Nov | 2551300 | 2402943 | 148357 | 5.8% |
| 2011 | Dec | 2547128 | 2396645 | 150483 | 5.9% |
| 2012 | Jan | 2539366 | 2370814 | 168552 | 6.6% |
| 2012 | Feb | 2539790 | 2376636 | 163154 | 6.4% |
| 2012 | Mar | 2541409 | 2387654 | 153755 | 6.0% |
| 2012 | Apr | 2532771 | 2389060 | 143711 | 5.7% |
| 2012 | May | 2538551 | 2390566 | 147985 | 5.8% |
| 2012 | Jun | 2572495 | 2408817 | 163678 | 6.4% |
| 2012 | Jul | 2565799 | 2400141 | 165658 | 6.5% |
| 2012 | Aug | 2558262 | 2401306 | 156956 | 6.1% |
| 2012 | Sep | 2540269 | 2385733 | 154536 | 6.1% |
| 2012 | Oct | 2561742 | 2412771 | 148971 | 5.8% |
| 2012 | Nov | 2558637 | 2415637 | 143000 | 5.6% |
| 2012 | Dec | 2557848 | 2407312 | 150536 | 5.9% |
| 2013 | Jan | 2558289 | 2390914 | 167375 | 6.5% |
| 2013 | Feb | 2538497 | 2386410 | 152087 | 6.0% |
| 2013 | Mar | 2543931 | 2393813 | 150118 | 5.9% |
| 2013 | Apr | 2545851 | 2401269 | 144582 | 5.7% |
| 2013 | May | 2557920 | 2402178 | 155742 | 6.1% |
| 2013 | Jun | 2592046 | 2415927 | 176119 | 6.8% |
| 2013 | Jul | 2604420 | 2433989 | 170431 | 6.5% |
| 2013 | Aug | 2589838 | 2429432 | 160406 | 6.2% |
| 2013 | Sep | 2562695 | 2402434 | 160261 | 6.3% |
| 2013 | Oct | 2563629 | 2402766 | 160863 | 6.3% |


— Bureau of Labor Statistics
